Introduction to TypeScript Debugging
TypeScript has revolutionized modern web development by bringing static typing, advanced language features, and robust tooling to the JavaScript ecosystem. While the TypeScript compiler (TSC) catches a vast number of potential errors before runtime, bugs are an inevitable part of the software development lifecycle. However, debugging TypeScript can present a unique challenge: the code you write isn’t the code the browser or Node.js runtime executes. It’s first transpiled into JavaScript. This compilation step can create a disconnect, making traditional debugging methods feel cumbersome. How do you set a breakpoint in a .ts file when the runtime only sees a .js file?
The answer lies in a powerful tool called source maps. These special files create a bridge between your original TypeScript source code and the compiled JavaScript output. By leveraging source maps, modern debuggers can seamlessly map the execution of the JavaScript code back to your TypeScript files. This allows you to set breakpoints, step through code, inspect variables, and analyze the call stack, all within the familiar context of your original .ts files. This article provides a comprehensive guide to mastering TypeScript debugging, from initial configuration and fundamental techniques to advanced strategies for both front-end and back-end applications.
Section 1: Core Concepts: Setting the Stage for Effective Debugging
Before you can effectively debug your TypeScript code, you need to configure your development environment correctly. This foundational step ensures that your debugger has all the information it needs to link the running JavaScript back to your TypeScript source. The cornerstone of this process is the proper configuration of your tsconfig.json file.
The Magic of Source Maps
A source map is a JSON file that contains mapping information. It tells the debugger, “This specific line and column in the compiled JavaScript file corresponds to that specific line and column in the original TypeScript file.” When you enable source map generation, the TypeScript compiler creates a .js.map file alongside each compiled .js file. When a debugger is attached and source maps are present, it reads these files to provide a seamless debugging experience directly within your TypeScript code, effectively hiding the transpilation layer from your workflow.
Configuring tsconfig.json for Debugging
Your tsconfig.json file is the central control panel for the TypeScript compiler. To enable debugging, you must turn on source map generation. Several key options within the compilerOptions section are crucial for this.
"sourceMap": true: This is the most important setting. It instructs the compiler to generate corresponding.js.mapfiles."outDir": "./dist": Specifies the output directory for the compiled JavaScript files. Keeping source and compiled files separate is a common best practice."rootDir": "./src": Specifies the root directory of your source TypeScript files. This helps the compiler maintain a clean project structure in the output directory."inlineSourceMap": false: When set totrue, this option includes the source map content directly within the JavaScript files instead of creating separate.mapfiles. This can be useful in some scenarios but generally, separate files are preferred for production builds."inlineSources": true: This option embeds the original TypeScript source code directly into the source maps. This makes the source maps self-contained and ensures the debugger can always find the source, even if the original files are moved.
Here is a practical example of a tsconfig.json file configured for a typical development environment that supports effective TypeScript debugging.
{
  "compilerOptions": {
    /* Type Checking */
    "strict": true,
    "target": "ES2020",
    "module": "commonjs",
    "esModuleInterop": true,
    "forceConsistentCasingInFileNames": true,
    "skipLibCheck": true,

    /* Debugging Configuration */
    "sourceMap": true,
    "outDir": "./dist",
    "rootDir": "./src",

    /* Recommended for robust debugging */
    "inlineSources": true
  },
  "include": ["src/**/*"],
  "exclude": ["node_modules"]
}
Section 2: Debugging TypeScript in the Browser
One of the most common use cases for TypeScript is building client-side applications that interact with the DOM. Modern browsers like Chrome, Firefox, and Edge come with powerful developer tools that have excellent support for TypeScript debugging, provided that source maps are available.

Using Browser DevTools with Source Maps
Once your project is compiled with source maps and served to the browser (often via a development server like Vite or Webpack Dev Server, which handle this automatically), you can open the developer tools (F12 or Ctrl+Shift+I). Navigate to the “Sources” tab (in Chrome) or “Debugger” tab (in Firefox). You’ll be able to browse your project’s file structure and find your original .ts files, not just the compiled .js files. From here, you can:
- Set Breakpoints: Click on a line number in your
.tsfile to set a breakpoint. The code execution will pause when it reaches this line. - Step Through Code: Use the controls to step over, step into, or step out of functions.
- Inspect Variables: Hover over variables in your code or use the “Scope” panel to inspect their current values.
- Use the Console: The console is fully interactive at a breakpoint, allowing you to execute code and inspect variables in the current scope.
Practical Example: Debugging a DOM Interaction Bug
Let’s consider a simple application that calculates the total price of items in a shopping cart. There’s a subtle bug where the total is being calculated incorrectly.
Here’s our TypeScript code (e.g., in src/main.ts):
interface CartItem {
  name: string;
  price: number;
  quantity: number;
}

const cart: CartItem[] = [
  { name: 'Laptop', price: 1200, quantity: 1 },
  { name: 'Mouse', price: 25, quantity: 2 },
  { name: 'Keyboard', price: 75, quantity: '1' as any }, // Intentional bug: quantity is a string
];

function calculateTotal(items: CartItem[]): number {
  let total = 0;
  items.forEach(item => {
    // The bug is here: string '1' will be concatenated, not added
    total += item.price * item.quantity;
  });
  return total;
}

function displayTotal() {
  const total = calculateTotal(cart);
  const totalElement = document.getElementById('total-price');
  if (totalElement) {
    // The result will be incorrect: "12501" instead of 1325
    totalElement.textContent = `Total: $${total}`;
  }
}

// Attach event listener to a button
document.getElementById('calculate-btn')?.addEventListener('click', displayTotal);
In this example, the `Keyboard` item has its `quantity` set as a string `’1’`. When `calculateTotal` runs, the line `total += item.price * item.quantity` will perform string concatenation instead of addition for that item. To debug this, you would open the “Sources” tab in your browser’s dev tools, find `main.ts`, and place a breakpoint inside the `forEach` loop. When you click the button, execution will pause. You can then inspect the `item` variable on each iteration. You would quickly see that for the keyboard, `item.quantity` is the string `”1″`, and the `total` variable unexpectedly becomes a string, revealing the source of the bug.
Section 3: Debugging TypeScript in a Node.js Environment
Debugging back-end applications written in TypeScript, such as an Express API or a NestJS service, is equally critical. The principles are the same—relying on source maps—but the tooling is different. The most popular and efficient way to debug TypeScript Node.js applications is by using the integrated debugger in an IDE like Visual Studio Code.
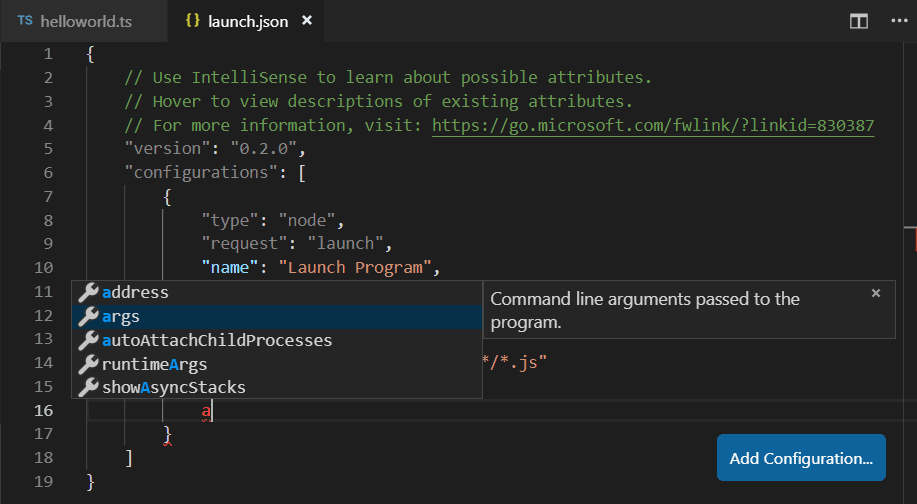
Configuring the VS Code Debugger
VS Code’s debugger can connect to a running Node.js process. To enable this for TypeScript, you first need to compile your code with source maps (as configured in `tsconfig.json`). Then, you create a launch configuration file, .vscode/launch.json, to tell VS Code how to start and attach to your application.
Here is a sample launch.json for a typical Node.js TypeScript project where the entry file is src/server.ts:
{
  "version": "0.2.0",
  "configurations": [
    {
      "type": "node",
      "request": "launch",
      "name": "Launch TypeScript Node App",
      "program": "${workspaceFolder}/src/server.ts",
      "preLaunchTask": "tsc: build - tsconfig.json",
      "outFiles": ["${workspaceFolder}/dist/**/*.js"],
      "sourceMaps": true,
      "smartStep": true,
      "internalConsoleOptions": "openOnSessionStart",
      "skipFiles": [
        "/**"
      ]
    }
  ]
}
Let’s break down this configuration:
"program": "${workspaceFolder}/src/server.ts": Specifies the main TypeScript file to run."preLaunchTask": "tsc: build - tsconfig.json": This tells VS Code to run the default TypeScript build task before launching the debugger. This ensures you are always debugging the latest version of your code. You must have this task configured in your.vscode/tasks.jsonfile."outFiles": This is a crucial setting. It tells the debugger where to find the compiled JavaScript files and their corresponding source maps."skipFiles": This useful option prevents the debugger from stepping into internal Node.js core modules, keeping your focus on your application code.
Practical Example: Debugging an Async API Endpoint
Let’s debug a simple Express API endpoint that fetches user data. The code has a bug related to handling an asynchronous operation.
import express, { Request, Response } from 'express';

const app = express();
const PORT = 3000;

// Mock async function to fetch user data
async function fetchUserData(userId: number): Promise<{ id: number; name: string; email: string }> {
  // Simulate network delay
  await new Promise(resolve => setTimeout(resolve, 100));

  // Simulate a potential issue where the API returns a different shape
  if (userId === 1) {
    return { id: 1, name: 'Alice', email: '[email protected]' };
  }
  // Bug: Returns an object with a 'username' property instead of 'name'
  return { id: userId, username: 'Bob', email: '[email protected]' } as any;
}

app.get('/users/:id', async (req: Request, res: Response) => {
  try {
    const userId = parseInt(req.params.id, 10);
    const user = await fetchUserData(userId);

    // This will work for userId=1, but fail for others
    const greeting = `Hello, ${user.name.toUpperCase()}`; // Bug: user.name is undefined for userId > 1

    res.json({ greeting });
  } catch (error) {
    res.status(500).json({ message: 'Error processing request', error: (error as Error).message });
  }
});

app.listen(PORT, () => {
  console.log(`Server is running on http://localhost:${PORT}`);
});
If you call this endpoint with `/users/2`, the application will crash with a `TypeError: Cannot read properties of undefined (reading ‘toUpperCase’)`. To debug this, set a breakpoint on the line `const greeting = …`. Launch the debugger in VS Code using your `launch.json` configuration. When you make a request to `http://localhost:3000/users/2` (using a tool like cURL or Postman), the breakpoint will hit. By inspecting the `user` object, you will immediately see that it has a `username` property but no `name` property, clearly identifying the mismatch between the data source and your code’s expectations. This demonstrates how debugging is essential for handling asynchronous code and data integration issues in TypeScript Node.js applications.
Section 4: Advanced Techniques and Best Practices
Beyond basic breakpoints, modern debuggers offer powerful features that can significantly speed up your workflow. Combining these tools with good coding practices creates a robust strategy for minimizing and quickly resolving bugs.
Conditional Breakpoints and Logpoints
Sometimes, a bug only occurs under specific conditions, such as inside a loop on the 100th iteration. Stopping at every iteration is inefficient. This is where conditional breakpoints come in. You can right-click a breakpoint and add a condition (e.g., `i === 99`). The debugger will then only pause when that condition evaluates to true.
Logpoints are an evolution of `console.log`. Instead of pausing execution, a logpoint prints a message to the debug console and continues. This is incredibly useful for tracing the value of a variable over time without modifying your source code. You can add expressions inside curly braces, like `Current value of user: {user.id}`, and the debugger will automatically log the interpolated string.
Leveraging the Full Power of the `console` Object
While breakpoints are powerful, never underestimate the utility of the `console` object. It’s more than just `console.log()`:
console.table(data): Renders tabular data (arrays of objects) in a clean, sortable table format. Perfect for inspecting API responses.console.trace(): Prints a stack trace to the console, showing the call path that led to the current point in the code.console.group('Label')andconsole.groupEnd(): Groups related log messages together in a collapsible block, helping to organize complex logging output.console.error()andconsole.warn(): Prints messages with distinct styling, making it easy to spot problems in a noisy console.
Best Practices for a Debug-Friendly Codebase
The best way to handle bugs is to prevent them. Adopting certain coding patterns and fully leveraging TypeScript’s features can make your code inherently easier to debug.
- Embrace Immutability: Avoid modifying data structures in place. Immutable patterns lead to more predictable state changes, which are easier to reason about and debug.
- Write Small, Pure Functions: Functions that are small, have a single responsibility, and produce no side effects (pure functions) are simple to test and debug. Their output depends solely on their input.
- Utilize TypeScript Types: Don’t fight the type system with `any`. Use strong TypeScript Types, TypeScript Interfaces, and Type Guards to ensure data consistency. The bug in our API example could have been caught at compile time if the return type of `fetchUserData` was properly typed and not asserted with `as any`.
- Enable Strict Mode: In your `tsconfig.json`, set `”strict”: true`. This enables a suite of type-checking behaviors that prevent common errors, such as `strictNullChecks`, which forces you to handle `null` and `undefined` values explicitly.
Conclusion
Effective TypeScript Debugging is a skill that transforms frustration into productivity. By understanding and properly configuring source maps, you can bridge the gap between your TypeScript source and the executing JavaScript, creating a seamless and intuitive workflow. Whether you are working on a front-end application with TypeScript React or a back-end service with TypeScript Express, the ability to set breakpoints, inspect variables, and step through your original .ts code is non-negotiable.
Mastering the tools at your disposal—from the browser’s developer tools to the powerful integrated debugger in VS Code—and adopting advanced features like conditional breakpoints and logpoints will elevate your development process. Ultimately, combining these powerful debugging techniques with best practices like writing clean, well-typed code is the most effective strategy for building reliable, maintainable, and robust TypeScript applications. The next time you encounter a bug, you’ll be fully equipped to find and fix it with confidence and precision.